8 September is International Literacy Day, an occasion to reflect on the status of literacy worldwide. Globally, 84% of all adults 15 years and older were able to read and write in 2011, the most recent year for which the UNESCO Institute for Statistics (UIS) has released data (see Table 1). Two regions, Central and Eastern Europe and Central Asia, are near universal literacy, with adult literacy rates of 99% and 100%, respectively. Literacy rates are assumed to be at a similarly high level in North America and Western Europe but data coverage is insufficient for the calculation of a regional average. Literacy rates are also high in East Asia and the Pacific (95%) and in Latin America and the Caribbean (92%). In the remaining regions, adult literacy rates are below the global average: Arab States (77%), South and West Asia (63%), and sub-Saharan Africa (59%).
Male and female adult literacy rates are at nearly the same levels in three regions: Central and Eastern Europe, Central Asia, and Latin America and the Caribbean (see Table 1). In the Arab States, East Asia and the Pacific, South and West Asia, and sub-Saharan Africa, female literacy rates are lower than male literacy rates. The gender parity index (GPI), the ratio of the female over the male literacy rate, shows that the biggest gender gap exists in South and West Asia (GPI 0.70) and in sub-Saharan Africa (GPI 0.74). Globally, the male literacy rate is 89% and the female literacy rate 80%, which yields a GPI of 0.90, far below the range of gender parity with GPI values between 0.97 and 1.03.
Table 1: Adult and youth literacy rate, 2011| Region | Adult literacy rate (%) | Youth literacy rate (%) | ||||||
| Total | Male | Female | GPI | Total | Male | Female | GPI | |
| Arab States | 76.9 | 84.7 | 68.4 | 0.81 | 89.9 | 93.2 | 86.5 | 0.93 |
| Central and Eastern Europe | 98.5 | 99.3 | 97.8 | 0.99 | 99.3 | 99.5 | 99.2 | 1.00 |
| Central Asia | 99.5 | 99.6 | 99.4 | 1.00 | 99.7 | 99.6 | 99.8 | 1.00 |
| East Asia and the Pacific | 94.7 | 96.9 | 92.5 | 0.95 | 98.9 | 98.9 | 98.8 | 1.00 |
| Latin America and the Caribbean | 91.6 | 92.2 | 90.9 | 0.99 | 97.1 | 96.8 | 97.4 | 1.01 |
| North America and Western Europe | - | - | - | - | - | - | - | - |
| South and West Asia | 62.8 | 74.0 | 51.9 | 0.70 | 80.7 | 86.8 | 74.9 | 0.86 |
| Sub-Saharan Africa | 59.1 | 68.1 | 50.6 | 0.74 | 69.5 | 75.6 | 63.7 | 0.84 |
| World | 84.1 | 88.6 | 79.9 | 0.90 | 89.5 | 92.2 | 86.8 | 0.94 |
Source: UNESCO Institute for Statistics, Data Centre, September 2013.
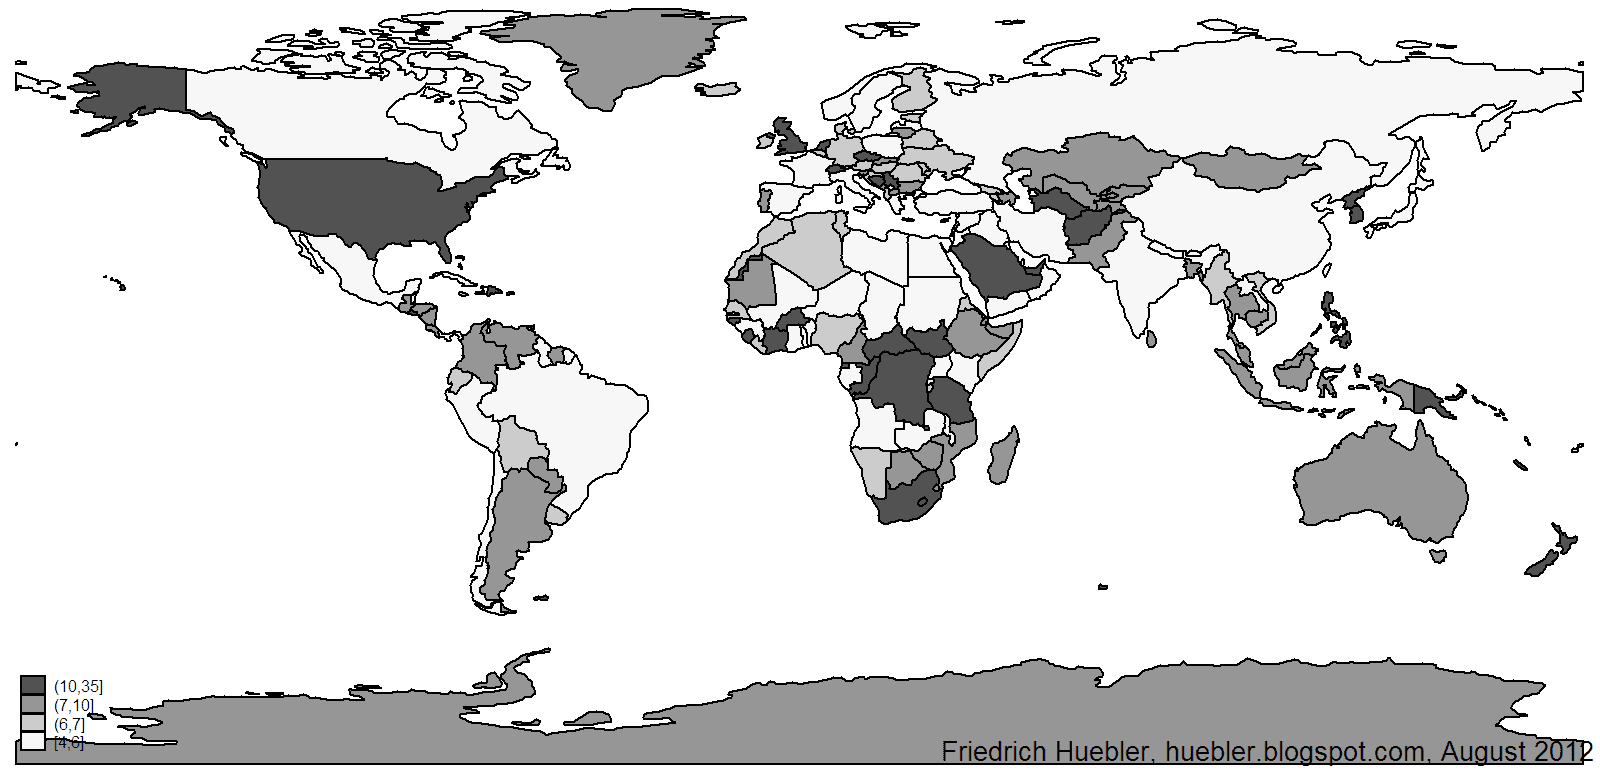
National adult literacy rates are displayed in Figure 1. Countries in sub-Saharan Africa and South and West Asia have generally lower literacy rates than countries in other regions. In 11 countries, nearly all in sub-Saharan Africa, fewer than half of all adults are able to read and write: Benin, Burkina Faso, Chad, Ethiopia, Guinea, Haiti, Liberia, Mali, Niger, Senegal, and Sierra Leone.
Figure 1: Adult literacy rate, 2011
Source: UNESCO Institute for Statistics, Data Centre, September 2013. - Click image to enlarge.
The UIS estimates that the adult illiterate population was 774 million in 2011 (see Table 2). Three out of four illiterate adults live in only two regions: South and West Asia (407 million) and sub-Saharan Africa (182 million). In all regions, the number of illiterate women is larger than the number of illiterate men. Globally, 493 million or two thirds of the adult illiterate population are female.
Table 2: Adult and youth illiterate population, 2011| Region | Adult illiterate population (000) | Youth illiterate population (000) | ||||||
| Total | Male | Female | % female | Total | Male | Female | % female | |
| Arab States | 47,603 | 16,082 | 31,521 | 66.2 | 6,037 | 2,099 | 3,938 | 65.2 |
| Central and Eastern Europe | 4,919 | 1,104 | 3,815 | 77.5 | 386 | 157 | 229 | 59.4 |
| Central Asia | 290 | 108 | 182 | 62.7 | 45 | 30 | 14 | 32.5 |
| East Asia and the Pacific | 89,478 | 26,356 | 63,122 | 70.5 | 4,081 | 2,005 | 2,076 | 50.9 |
| Latin America and the Caribbean | 35,614 | 15,994 | 19,620 | 55.1 | 3,043 | 1,676 | 1,367 | 44.9 |
| North America and Western Europe | - | - | - | - | - | - | - | - |
| South and West Asia | 407,021 | 147,352 | 259,669 | 63.8 | 61,778 | 22,316 | 39,461 | 63.9 |
| Sub-Saharan Africa | 181,950 | 70,535 | 111,414 | 61.2 | 47,558 | 19,196 | 28,362 | 59.6 |
| World | 773,549 | 280,366 | 493,184 | 63.8 | 123,198 | 47,626 | 75,571 | 61.3 |
The global youth literacy rate, for the population 15 to 24 years of age, was 90% in 2011 (see Table 1). Youth literacy rates are higher than adult literacy rates in all regions, a result of increased levels of school attendance among younger generations. Of the regions with data, four are near universal youth literacy: Central and Eastern Europe (99%), Central Asia (100%), East Asia and the Pacific (99%), and Latin America and the Caribbean (97%). In the Arab States, the youth literacy rate is 90%. In South and West Asia (81%) and sub-Saharan Africa (70%), the youth literacy rate is below the global average.
Literacy rates among the population 15-24 years are not only higher than among the total population 15 years and older, there is also a smaller gap between the literacy rates of young men and women (see Table 1). However, gender disparity in youth literacy is observed in the Arab States (GPI 0.93), South and West Asia (GPI 0.86), and sub-Saharan Africa (GPI 0.84); in these regions, young women are less likely to be able to read and write than young men. At the global level, the male youth literacy rate is 92% and the female youth literacy rate 87%.
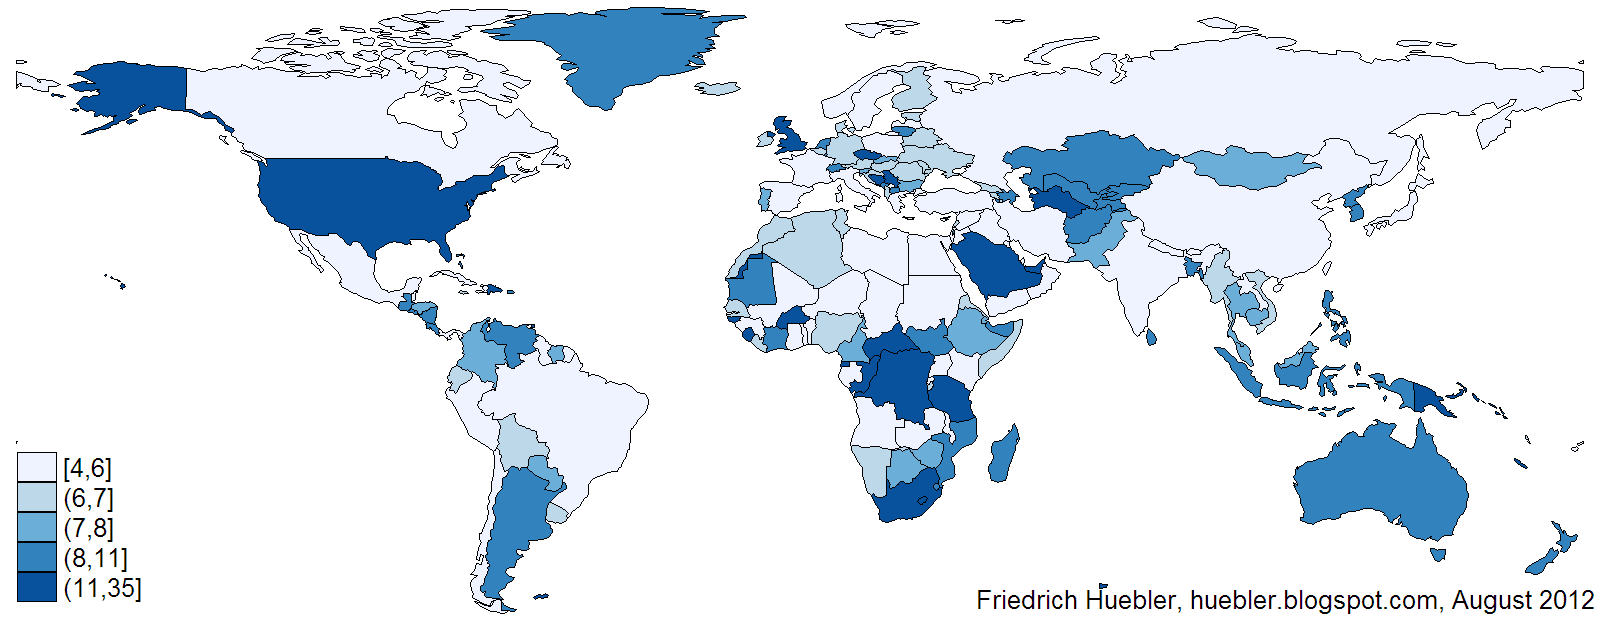
National youth literacy rates are displayed in Figure 2. Sub-Saharan Africa stands out as the one region where youth literacy rates are significantly lower than in other regions. Seven countries have youth literacy rates below 50%: Benin, Burkina Faso, Chad, Guinea, Liberia, Mali, and Niger.
Figure 2: Youth literacy rate, 2011
Source: UNESCO Institute for Statistics, Data Centre, September 2013. - Click image to enlarge.
The youth illiterate population, a subset of the adult illiterate population, was estimated at 123 million in 2011 (see Table 2). Illiterate youth are concentrated in South and West Asia and sub-Saharan Africa; 89% of the global population of illiterate youth live in these two regions. Whereas women are the majority of illiterate adults in all regions, there is no such clear pattern among illiterate youth. In two regions, Central Asia and Latin America and the Caribbean, young men are more likely to lack basic reading and writing skills than young women. Even so, 61% of the global number of illiterate youth are female.
More detailed statistics and analysis are available from the the UNESCO Institute for Statistics, including a page with an interactive world map with adult and youth literacy rates, a fact sheet on adult and youth literacy, an infographic for International Literacy Day 2013, and a report on national, regional and global trends in adult and youth literacy between 1985 and 2015.
Related articles
- Adult and youth literacy in 2010
- Trends in adult literacy, 1990-2008
- Disparity between male and female literacy rates
- Disparity between adult and youth literacy
- Years of schooling and literacy: Can everyone with primary education read and write?
- Years of schooling and literacy, part 2
- Adult literacy in sub-Saharan Africa
- Reported and tested literacy in Nigeria
- Adult literacy in Nigeria
External links
- International Literacy Day
- UNESCO Institute for Statistics (UIS)
- UIS Data Centre
- UIS page for International Literacy Day 2013, with interactive world map with adult and youth literacy rates
- UIS fact sheet on adult and youth literacy, September 2013 (PDF, 176 KB)
- UIS infographic for International Literacy Day 2013 (PDF, 752 KB)
- UIS report Adult and Youth Literacy: National, Regional and Global Trends, 1985-2015, June 2013 (PDF, 940 KB)
Permanent URL: http://huebler.blogspot.com/2013/09/literacy.html